Page 1 of 1

Promising Tropo Saturday 18/1/25

Posted: Fri Jan 17, 2025 11:55 am
by radiogareth
Yesterday afternoon and evening saw some good tropo - Rob was getting into GB3SQ...
Looks promising for tomorrow for the UK at least. Anyone around want to try 70cms?
Other bands possible with advance warning.
I'll be at home JO01AI09 just 100m from the Greenwich meridian.
Gareth
Tropo.PNG
Tropo.PNG (225.71 KiB) Viewed 4498 times

Re: Promising Tropo Saturday 18/1/25

Posted: Fri Jan 17, 2025 5:19 pm
by g0mjw
I will think about setting up Gareth if the trop is good, we can test it with FT8, using it like a reverse beacon. My problem is I can't rapidly switch DATV and normal SSB/CW, something I need to address.

Mike

Re: Promising Tropo Saturday 18/1/25

Posted: Sat Jan 18, 2025 12:33 pm
by radiogareth
Promising except that my pump-up mast won't pump up so that negates any play today :-(
Seems several layers of bubble wrap wasn't enough to stop a bit of frost upsetting the seals. Had similar last winter but on dismantling found no issues....and then it worked.....
Its a Hi-Lo, not a Clarke, so reasonably simple to take apart and check.
Gareth

Re: Promising Tropo Saturday 18/1/25

Posted: Sat Jan 18, 2025 2:21 pm
by M0DTS
I Have 70cm antenna up here at home but still odd conditions!
Hearing 2M FT8 well into Germany using just a vertical antenna! but 2m and 70cm uk beacons are weak.

I think its favouring 2m more than higher bands...
Inversion layer is about 600m up at Nottingham, and 800m up at Newcastle, probably explains the good long dx but not much 'local'...

Rob

Re: Promising Tropo Saturday 18/1/25

Posted: Sun Jan 19, 2025 4:37 pm
by g4saq
Hi Rob. Please will you be kind enough to post a link to those upper air temp plots. Very interesting.
73
Russ.

Re: Promising Tropo Saturday 18/1/25

Posted: Sun Jan 19, 2025 6:44 pm
by M0DTS
Hi Russ,

I generate them from Met Balloon sonde data, the images don't get published anywhere (could be done) but they can be seen on GB3KM's carousel often.

The raw data for the soundings can be found here:
https://weather.uwyo.edu/upperair/sounding.html

I used a calculation from Mike G0MJW to get the Refractivity figure, you can find that info here:
http://www.mike-willis.com/Tutorial/PF6.htm

Rob

Re: Promising Tropo Saturday 18/1/25

Posted: Mon Jan 20, 2025 12:36 pm
by g8gtz
I was going to ask the same question!

The plots are great - be good to get them published on a daily basis somewhere, I'm sure BATC would be willing to host them if it helped.

Noel

Re: Promising Tropo Saturday 18/1/25

Posted: Mon Jan 20, 2025 5:38 pm
by g0mjw
If you want to generate something in N units process the text file using a regular expression or similar in bash or as I did, just drop into an excel spreadsheet. I see I last did that in 2006. Will it still work? Sort of. Just needed the right columns selecting.
Screenshot 2025-01-20 171735.png
Screenshot 2025-01-20 171735.png (19.19 KiB) Viewed 3684 times
This is what you get from the university of Wyoming

03354 Nottingham Observations at 12Z 20 Jan 2025
-----------------------------------------------------------------------------
PRES HGHT TEMP DWPT RELH MIXR DRCT SKNT THTA THTE THTV
hPa m C C % g/kg deg knot K K K
-----------------------------------------------------------------------------
1004.0 118 3.0 -0.3 79 3.74 225 5 275.8 286.2 276.5
1000.0 149 3.0 -0.4 78 3.73 230 6 276.1 286.5 276.8
993.0 206 2.4 -1.0 78 3.58 235 10 276.1 286.1 276.7
988.0 247 2.0 -1.5 78 3.48 245 12 276.1 285.8 276.7
<SNIPPED>

Here is what I have used to make the graph - the column orders have changed maybe so might need to adapt test to columns in excel, we only need 4 of them, HGHT, PRES TEMP and MIXR in columns A, B, C and D. Then calculate in excel.

A B C D E F G
HGHT PRES TEMP MIXR

118 1004 3 3.74 276 4.756866359 305.5763174
149 1000 3 3.73 276 4.744147465 304.3894009
206 993 2.4 3.58 275.4 4.543465438 302.1439381
247 988 2 3.48 275 4.410138249 300.5474587
263 986 2.6 3.03 275.6 3.848239631 296.5233993

I first change from centigrade to Kelvin simply because it makes the next bit easier.

I.e. Column E3 has "=C3+273" in it - the temperature in K
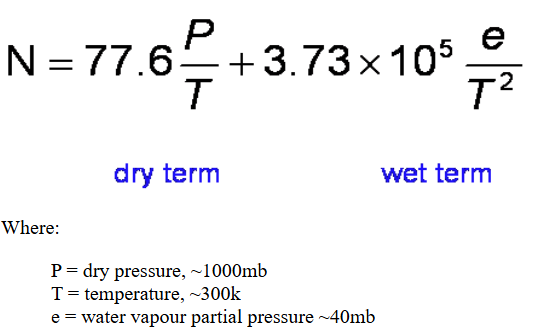
Column F3 has "=D3*E3/217" in it - what I call e in the equation on my website, the water vapour partial pressure.
Column G3 has "=77.6*B3/E3+373000*F3/(E3*E3)" in it which is the refractivity in N units.

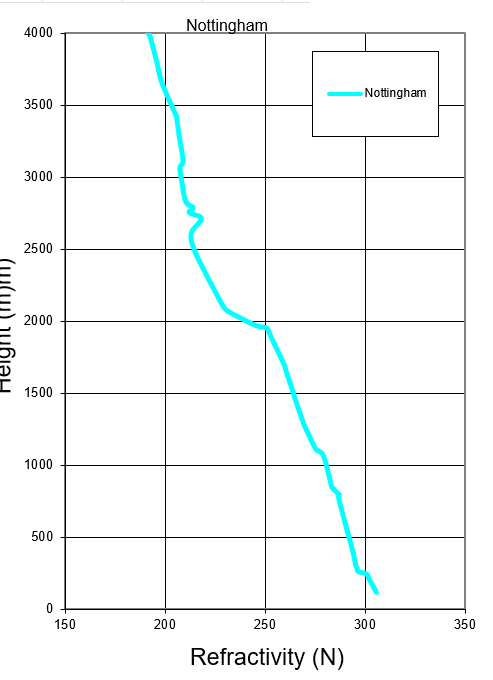
So then just plot N as an XY graph against height.
Screenshot 2025-01-20 173627.png
Screenshot 2025-01-20 173627.png (31.43 KiB) Viewed 3684 times
Not sure this is entirely accurate but good enough for our use, so use at own risk. Obviously if you wanted a web version you would simply do the calculation in a scrips and send it to a plotting package.

Mike

Re: Promising Tropo Saturday 18/1/25

Posted: Tue Jan 21, 2025 7:59 pm
by M0DTS
I'm working on a new website so I'll put them up there as and when data is available.
Sometimes it's 12h intervals and others it's a day or two depending on what they require.

Rob